
Six decades of aerial photographs reveal a change so gradual it would have been almost impossible to see while it was happening.
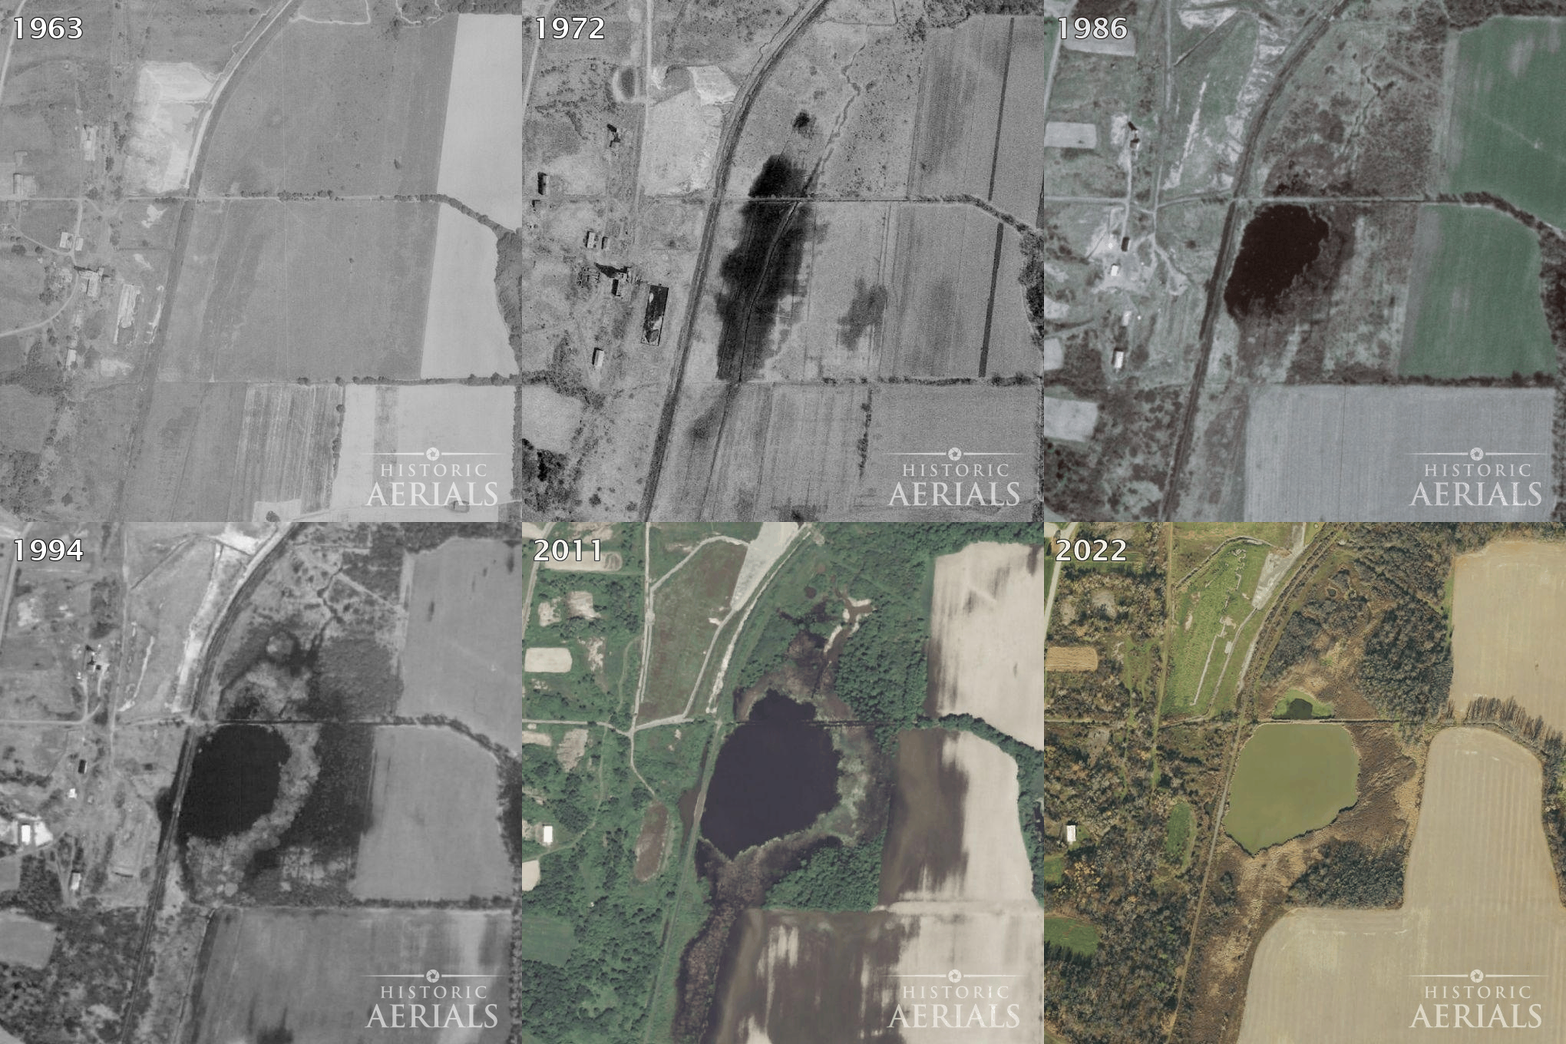
In 1963, the field east of the old Pennsylvania Railroad line is plainly farmland. Cropped fields fill the frame, and a lane lined with trees crosses it from east to west. Nothing in the image suggests standing water.
By 1972, a dark patch has spread along a faint diagonal line through the field, possibly a buried drain, with a smaller patch in the field beside it. Frames from different seasons vary in tone, and one wet spring can darken a low corner without meaning much. By 1985 the wet ground is hard to dismiss, and in 1986 it has become a defined pond. The 1994 frame shows it larger, ringed by wet vegetation. It’s still there in 2011 and 2022, and the lane that crossed dry ground in 1963 now runs between the main pond and a smaller pool to its north.
So why did a farm field turn into a pond? The search for an answer starts about a mile south, and 1,100 feet underground.
The 1994 Retsof Salt Mine Collapse and the Cuylerville Sinkholes
On April 6, 1994, the ground near Cuylerville dropped into a sinkhole about 300 feet across. Three and a half weeks earlier, on March 12, the ceiling of a mining panel in the Retsof salt mine had failed 1,100 feet down, setting off a magnitude 3.6 seismic event. Water from the aquifers above poured in, dissolving salt and weakening the pillars that held the roof up. A second panel collapsed on April 8, and a second, larger sinkhole opened on May 25. The mine, which began operating in 1885, lies under more than 6,000 acres.
The aerial frames show the surface result. In 1986, Beards Creek winds through a narrow belt of trees just south of Route 20A. In the 1994 frame, a dark body of open water sits in that corridor. The sinkholes closed the Route 20A bridge over the creek, and by January 1996 the mine was completely flooded. By 2005 there are two ponds, consistent with USGS’s account of a pond forming in each sinkhole as the creek shifted course. By 2022 no open water shows, and the ground appears wooded again.
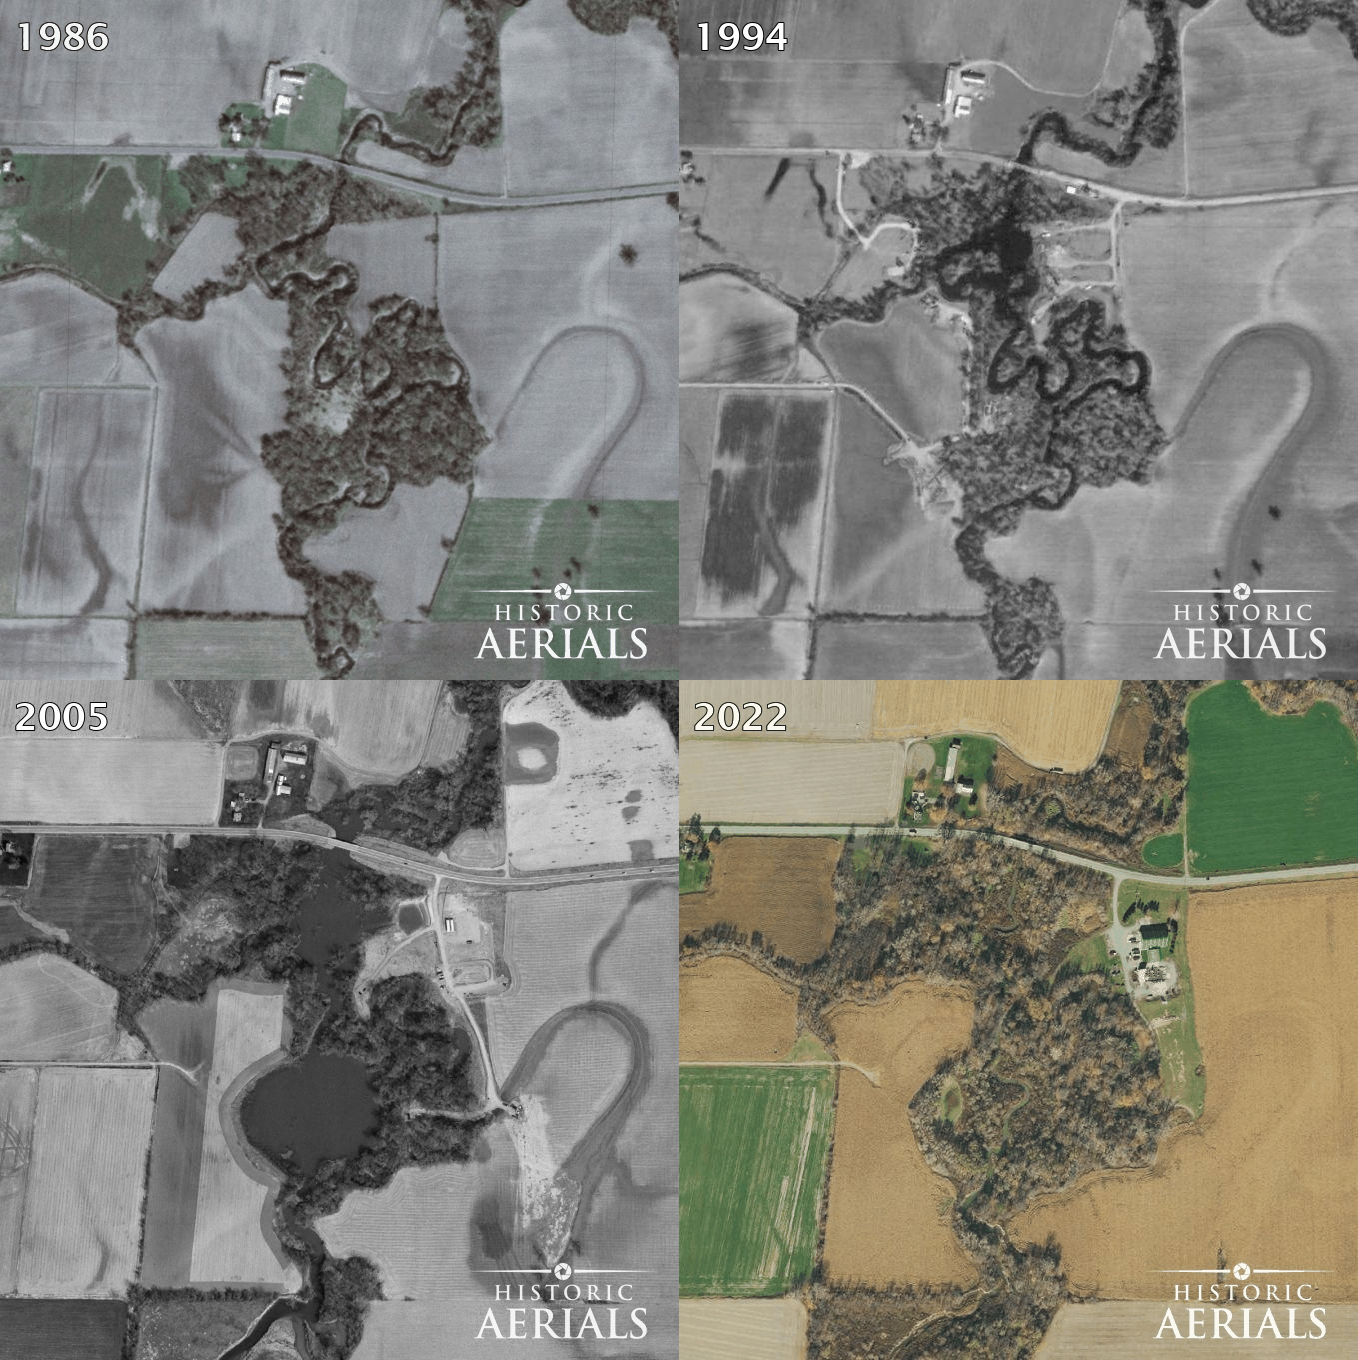
That’s the change everyone looks for: sudden, violent, and documented by seismographs, engineers, and a federal study. The pond a mile north began in the wrong decade. It was open water by 1986, eight years before the sinkhole opened. Whatever started it, the collapse didn’t.
LiDAR Shows the Pond Sitting Over the Old Sterling Mine
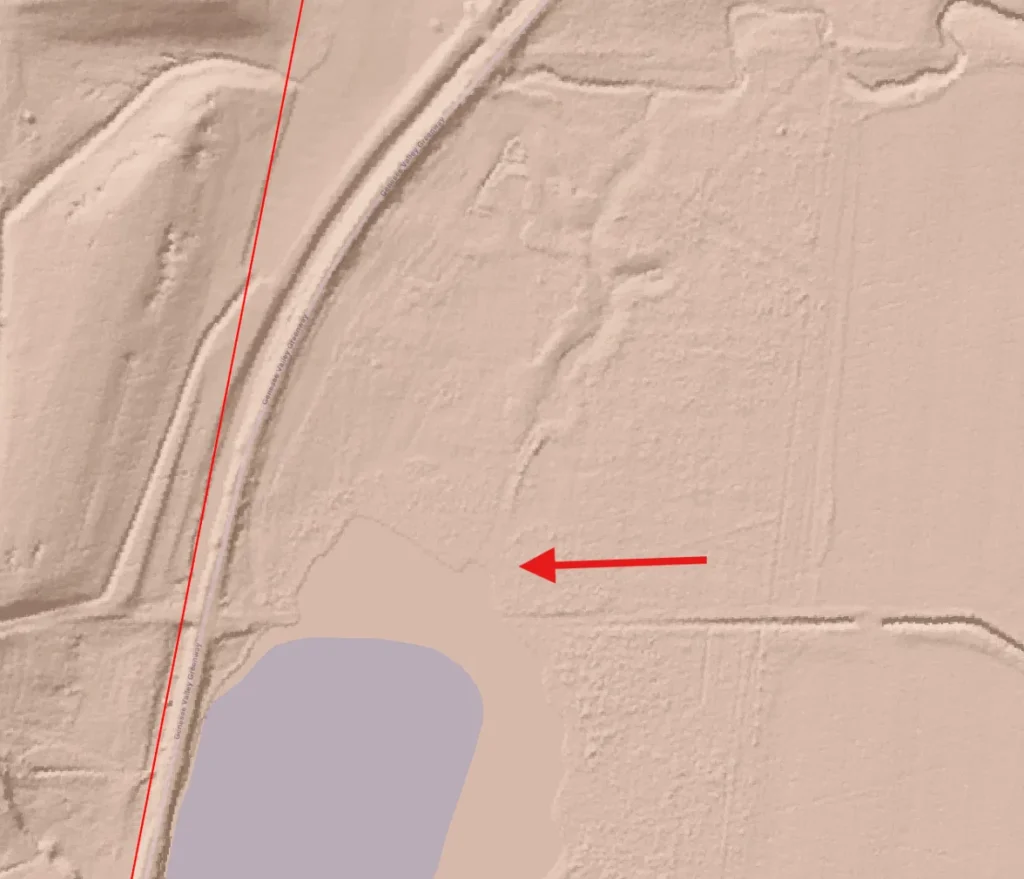
The pond sits in a hollow. A laser-scanned elevation map of New York State, flown in 2019, shows higher ground on every side. The railroad embankment doesn’t explain it: the pond is on the downhill side of the roadbed, where water would drain away, not collect.
USGS’s map (Yager, Miller and Kappel 2001), placed over that elevation data, puts the pond inside the Sterling Mine, an older, abandoned mine that was later connected to Retsof for ventilation. The map was drawn at a coarse scale, so its position is good to perhaps 130 feet; the pond sits well inside that margin. Ground inside the mapped outline averages roughly 2.5 feet lower than ground just outside it, and south of the pond the land climbs and levels off almost exactly at the outline’s edge.
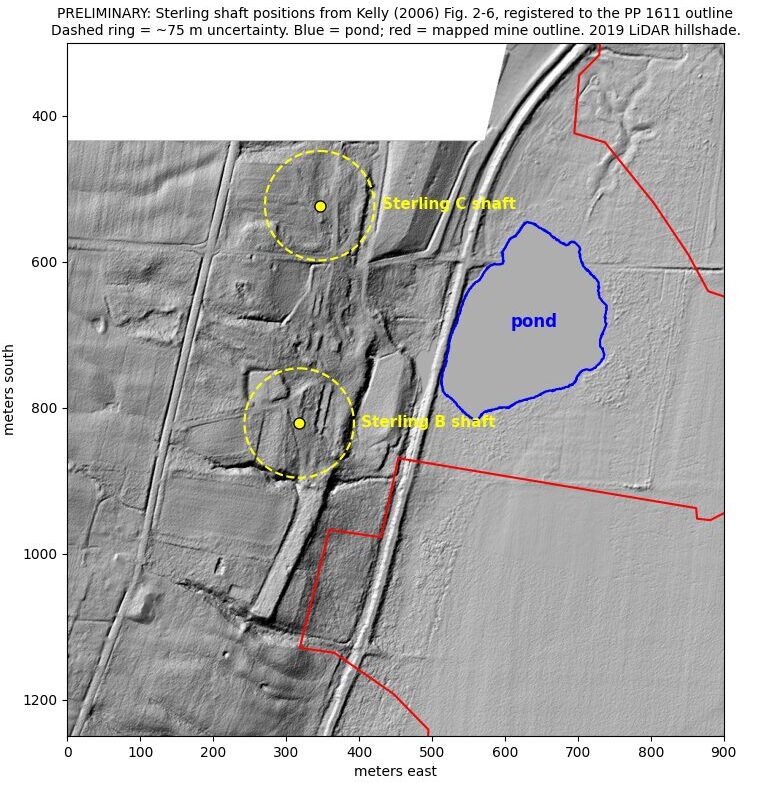
The Serling mine has its own history. Engineering studies cited by USGS traced water leaking into a Sterling shaft through fractures in the limestone above, at rates that climbed from the 1930s to an estimated 300 gallons a minute by 1986. Water dissolves salt, and salt workings close slowly under the rock above them. Those are the processes USGS gives for most of the ground loss over Retsof after 1994. Whether they were at work at Sterling, and when, is something the photographs can’t show.
Could a Failed Farm Drain Explain the Pond?
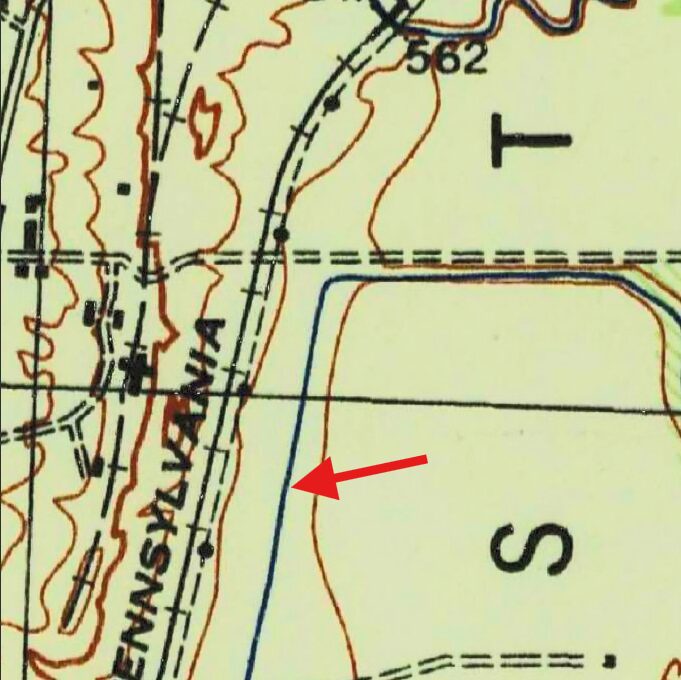
A field can also turn to pond when its drain fails, and this one was drained. The 1944 USGS topographic map draws a blue channel, straight enough to suggest it was dug, running north along the east side of the railroad and then east beside the lane toward the river.
Today’s elevation map shows that ditch still sloping toward the river, with one exception. A stretch about 50 feet long sits at field level, roughly 2 feet above the pond’s surface. Water can’t run uphill, so the pond would have to rise about 2 feet before it could drain along the ditch. Whether that stretch is a filled farm crossing, a collapsed culvert, or something else, and when it formed, is unknown. The valley floor is also a floodplain, and a naturally low corner with a failed drain would hold water without any help from a mine.
Both could be true. A drain can fail on its own, and a sinking field can defeat one. The imagery alone can’t say which came first.
Richard Young, a geologist at SUNY Geneseo who spent years dealing with the 1994 events, wrote after reviewing the findings: “I have no doubt the feature is related to old salt mine subsidence.” He added a caution that applies to everything above: measurements made here before the shaft leakage and the 1994 collapse were casual and too imprecise to test a timeline like this one.
Slow Mine Subsidence Leaves No Paper Trail
The elevation map is a single snapshot from 2019. It shows where the ground is low, not when it dropped, and USGS expects the ground above most of the mine to keep sinking another 8 to 9 feet over a century, so part of today’s hollow may be newer than the pond. No one has established whether water reached the workings beneath it, and the date the drain failed is unrecorded. The best chance of finding ground observations is in the two Sterling shaft studies USGS cites: Langill and Associates (1981) and Acres International (1986).
The collapse arrived with a seismograph record, a closed bridge, and a federal study. The pond arrived as a darker patch in a field, in years when nobody was measuring. Slow subsidence rarely leaves a paper trail: no claim is filed when a corner of a field turns wet, and there’s no crater to photograph. Livingston County’s 2022 hazard mitigation plan, drawing on the state geological survey, acknowledges that subsidence records in New York are sparse and that some incidents were probably never reported. Where the record is that thin, aerial photographs taken for other reasons can be the only continuous witness.
Sources
- Yager, R.M., Miller, T.S., and Kappel, W.M. (2001). Simulated Effects of 1994 Salt-Mine Collapse on Ground-Water Flow and Land Subsidence in a Glacial Aquifer System, Livingston County, New York. USGS Professional Paper 1611.
- Livingston County (2022). Hazard Mitigation Plan, mine subsidence section.
- New York State 1-meter LiDAR elevation data (2019), NYS ITS Geospatial Services.
- USGS topographic map, 1944.
- Langill and Associates (1981), Geological and Hydrological Conditions at the Sterling Mine near Cuylerville, New York, and Acres International (1986), Sterling Mine B Shaft: Geotechnical Summary Report, as cited in USGS Professional Paper 1611.
- Richard Young, geologist, SUNY Geneseo, personal communication, September 2026.